ECOMAN
Ecosystem based management of fish stocks in the North Sea
ECOMAN aims to support fisheries management both for single stocks and for stocks that are linked because they eat each other or are caught together in the same fisheries. This is achieved by improving the calculation of model input from data, examining changes in stock productivity and natural mortality, and by involving mixed fisheries and multi-species considerations
Project highlights
Quantifying the size of fish stocks in hindsight and as predictions of “tomorrow” is key for fisheries management. Fish stock size is a combination of productivity and mortality (incl. fishing). Traditionally, fisheries management has taken a stock-by-stock approach, treating each stock in isolation without considering interactions with other stocks and the environment.
In order to begin the transition from a single-stock approach to an ecosystem based fisheries management, we first of all need to combine information across stocks to gain sufficient overview, secondly, we need to consider the many processes that impact productivity, both the internally driven (i.e. intra-specific density dependence) and the externally driven (i.e. the environment). Thirdly, we need to understand interlinkages between stocks; for example who each whom and what species are caught together in the same fisheries.
Productivity can be the growth of the individual fish or the number of young fish entering the stock (the recruitment; R). Productivity and fishing varies over time, which leads to fluctuations in stock size. Productivity is not only affected by fishing (when fished below certain thresholds, i.e. Blim), but also density dependent processes, spawner quality, and the environment may impact productivity and lead to fluctuations in stock size as well as high and low productivity regimes. Here, we present a series of simple interactive applications that can help understand the many aspects of stock productivity. The stock specific examples mainly focus on 11 selected data rich North Sea stocks.
Mortality in fish stocks can be divided into fishing mortality and natural mortality. Natural mortality is primarily driven by predation. Natural mortality is in generally difficult to estimate, but the multispecies SMS model is an advanced attempt to do exactly so. The user is able to test different effort scenarios and explore how changes in fishing mortality on predatory stocks affects the natural mortality of prey species.
Most species are caught in mixed fisheries, and therefore, fishing mortality of each stock depends on biological and economical factors. This can lead to choke species. The last application shows that result of a complex multi-species multi-fleet model (FLBEIA) for the North Sea under different effort and gear selectivity scenarios.
You can either work your way through the different applications by scrolling down on this web page from top to bottom or you can jump to selected topics by clicking on the headers above.
North Sea stocks productivity
- Stock dynamics, biomass thresholds (Blim), and stock productivity
- Stock indicators
- Density dependence
- Spawner quality
Stock dynamics, biomass thresholds (Blim), and stock productivity
Often stocks dynamics (i.e. how they fluctuate over time) is depicted as time-series of Spawning Stock Biomass (SSB; the biomass of the mature fraction of the stock) and the recruitment (R). R is the result of the SSB. In the application below, you can see results for the most important North Sea stocks. Under Stock summary you can select a stock. Estimates of SSB and recruitment are the outputs from age-based stock assessments provided by ICES and presented in the official advice sheets. The time series are presented as anomalies (Green means that values are above the long-term mean)
You can also see the mean weight of one year old fish in the stock, which provides an indication of how fast (or slow) the fish grow.
Under Blim calculator you can compare two different definitions of the Blim reference point, i.e. the critical lower level of SSB below which recruitment is impaired. Effective management should ensure that SSB is kept above Blim. Blim-type1 requires a definition of what you think is a ”good recruitment”; in the default setting, ”good recruitment” is above the 75% of the lowest observed values. You can also test how robust the estimated Blim is by changing the range of years you want to include in the calculation. The top graph shows the time-series of SSB and the estimated Blim (horizontal lines: blue = type1 and red = type2). The bottom graph shows the modelled relationship between SSB and R (Blim shown as vertical lines). Note that the stock-recruitment relationship can take many forms. For example, recruitment of North Sea herring (her.27.3a47d) increases with increasing SSB only at low values of SSB. At higher SSB values recruitment is relatively stable, due to density dependent regulation.
Under Stock productivity you can see different measures of stock productivity over time grouped by how similar they are. A measure of productivity can be the number of recruits produced per spawner biomass (R/SSB). You can select a productivity measure and see how it has developed over time across stocks in the North Sea. The results are presented as positive versus negative anomalies (red positive) if the checkbox is checked. If you for example choose log(R/SSB) and tick off the box, you can see stocks such as cod, herring, haddock and sprat produced many recruits per spawner in the 70s, 80s, and 90s, whereas, whiting, sandeel and mackerel show a different temporal pattern.
Stock indicators
Indicators are required to assess the health of fish stocks or ecosystems in general. By combining information of indicators one can infer the general state of the stock, as most indicators are altered by fishing and other anthropogenic impacts.
In this application we calculate various indicators for a range of commercially exploited fish stocks. The indicators calculated in the application are 1) mean length, 2) mean age, 3) age at 50% maturity, 4) mean weight, 5) length at 50% maturity, 6) number of recruits per spawner, 7) recruitment anomalies, and 8) average natural mortality. The application works by selecting a stock in the drop-down menu (e.g., cod.27.47d20, cod in the North Sea and Skagerrak), and then choosing the age span at which to perform the calculations, by choosing a minimum and a maximum age. The application will automatically provide the available ranges for each stock. Lastly, the user has to decide on the years to show in the figures by choosing a minimum and a maximum year, if they wish to focus the calculations in a specific period. In stocks and years where the calculation is possible the variance (represented by the 10th and 90th confidence bounds) is shown with red shading.
To see or update the indicators for a new stock and/or settings, press the ‘Calculate indicators’ button.
Density dependence
Although rarely accounted for in fisheries management, fish stocks can be experiencing density dependent regulations in several ways. Here we explore three different types of density dependent regulation:
(1) A large year class (i.e. large R) result in competition for resources (food) and therefore growth among the young fish decline (R vs growth).
(2) A large stock biomass result in food competition and less food for the individual fish (Stock biomass vs growth).
(3) R decreases at very high levels of SSB because of density dependent processes such as cannibalism (R overcompensation).
We investigated to what extent the eleven North Sea stocks show signs of density dependent regulation. In case of the two first types of density dependent regulation, the horizontal bar plot depicts the correlation coefficients of recruitment (R) or stock biomass versus growth of the relevant age groups, and a red horizontal bar with a black box around indicate statistically significant density dependent regulation. In case of overcompensation (the third type), a blue bar with a black box around it indicate significant overcompensation. Note that 8 out of 11 stocks show signs of significant density dependent regulation when correlating stock biomass and growth, and had.27.46a20 actually shows signs of significant density dependent regulation for all three types.
Spawner quality
The assumption of a relationship between SSB and R has been an imperative element in fisheries science since the 1950s. Most conventional stock-recruitment models assume that R is proportional to SSB, independent of size, age and body condition. However, recent research has caused a debate of whether the empirical evidence for individual-level relationships between spawner quality and reproductive potential is relevant also for fisheries management. This has therefore also recently been incorporated into the GES indicators under the European Marine Strategy Framework Directive as a need to ensure that commercially fished stocks are ‘characterised by a high proportion of old, large individuals’.
Here the correlations between R (after accounting for SSB) and spawner quality are calculated for the eleven North Sea stocks. The horizontal bars indicate the correlation coefficients and a black box around the horizontal bar indicates if the correlation is statistically significant. Three different proxies for spawner quality was used. As can be seen, positive correlations between spawner quality and R was only found for spawner weight (a measure of body condition), and surprisingly, negative correlations was seen for all eleven stocks for the two remainder measures of spawner quality. Furthermore, the overall impression was that proportion of old spawners and spawner age have today returned to levels observed early in the time-series, where fishing pressure was more or less the same as today, although the differences between stocks are pronounced.
Environmental variability
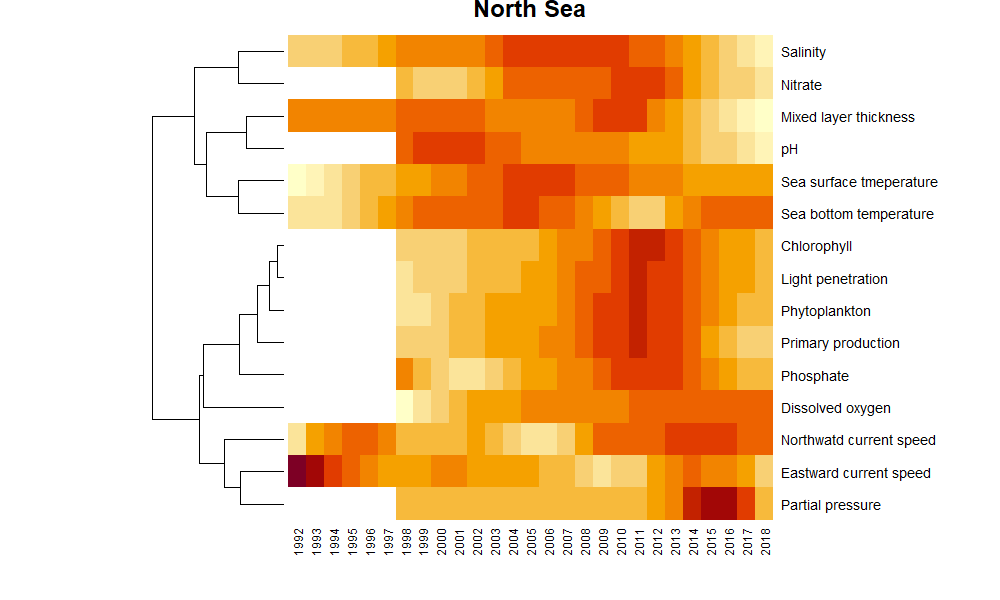
The productivity that is observed in our ocean ecosystems are closely coupled to the environmental variability. Thus, it is essential to develop methods that may capture the environmental fluctuations, which may account for some of the variation. This overview is merely a presentation of some publically available environmental data for both scientists and stakeholders. Data were obtained from the Copernicus project under the European Commission (Copernicus website). Annual averages were calculated (averaging across grid cells, months and depth) and converted into anomalies for the North Sea region. The methodology includes model smoothing and clustering that provide a general overview here depicted as a heatmap, where red represents high values.
Multispecies and mixed fisheries models


The ECOMAN project
Funding
The ECOMAN project, "Ecosystem based management of fish stocks in the North Sea", was funded by the European Maritime and Fisheries Fund (EMFF) and the Danish Ministry of Environment and Food (grant ID: 33113-B-19-150).